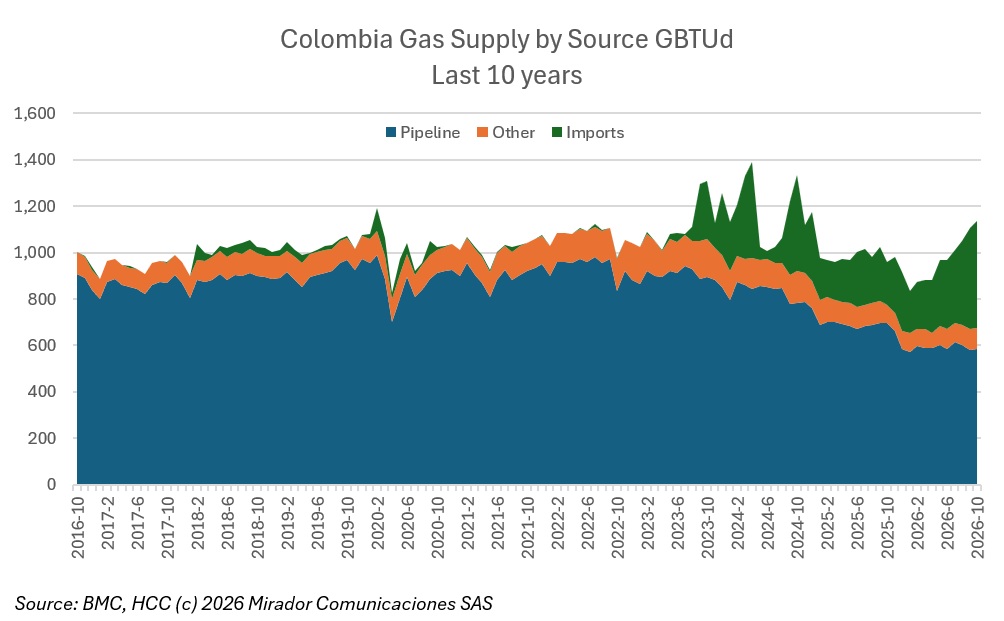
The lead graph shows rapidly declining domestic production (Pipeline and Other) and rapidly increasing demand (the outer envelope of the graph), leading to even more rapid increases in imports /green). OK. We knew that.
This Exchange Rate is for reference, taken from Google Finance
Last Business Day end-of-day prices




 Login
 Signup