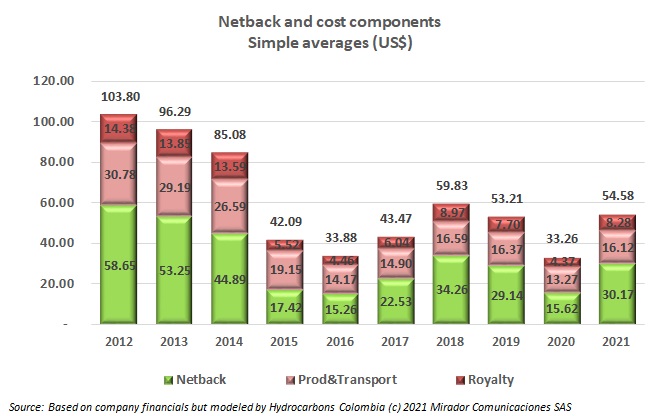
We updated our Netback charts based on 1Q21 results from major Colombia-focused publicly-traded E&P companies. This time we introduce a new chart showing how Production & Transport Costs vary with Average Realized Oil Prices.
This Exchange Rate is for reference, taken from Google Finance
Last Business Day end-of-day prices


 Login
Login Signup