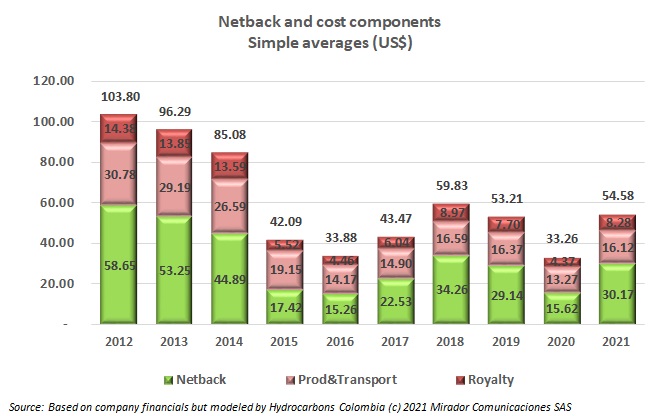
We updated our Netback charts based on 1Q21 results from major Colombia-focused publicly-traded E&P companies. This time we introduce a new chart showing how Production & Transport Costs vary with Average Realized Oil Prices.
This Exchange Rate is for reference, taken from Google Finance
Last Business Day end-of-day prices
We use cookies to ensure that we give you the best experience on our website. If you continue to visit our site you agree with our cookies policy.OkCookies Policy


 Login
Login Signup