

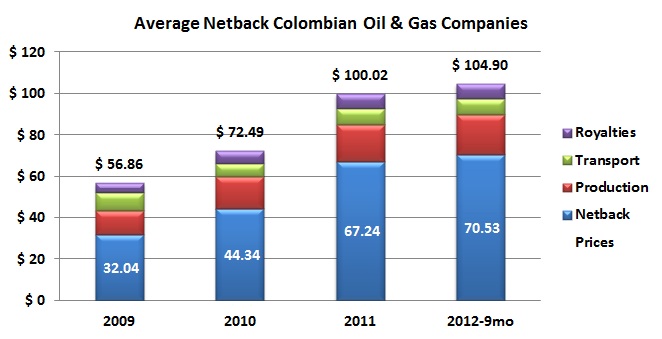
The graph shows netback and cost broken down into three major categories: royalties, transport and production. The values are averaged over the seven publicly traded companies whose majority business is in Colombia and who provide enough data to do this graph.
2026, Hydrocarbons Colombia, All Rights Reserved.
 Login
Login Signup