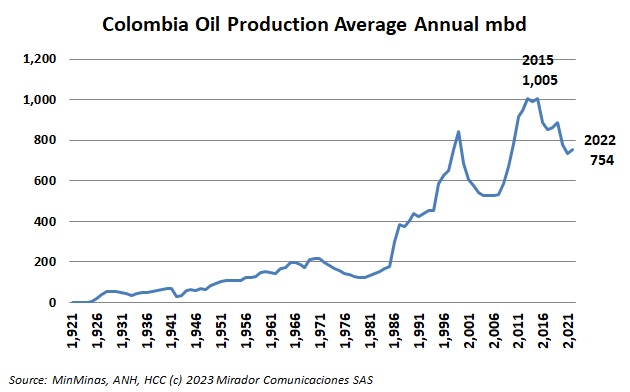

We normally publish our statistical review of the previous year around mid-first-quarter. But some key figures were delayed so we decided to wait until the end of the quarter. Hoping you find these charts useful for presentations or strategic discussions. Subscribers can request the Excel versions to do their own graphic design.